Neutrophil NETosis — end-to-end
This example follows the analysis from the napari-lattice manuscript: quantifying the dynamics of human neutrophils undergoing NETosis, imaged live on a Zeiss LLS7.
The dataset is a 6-hour timelapse (2-minute intervals) of LPS-stimulated neutrophils with SPY650-labelled nuclei. Instead of processing the whole field of view, each cell is cropped to a region of interest (ROI) defined on the acquisition MIP, then deskewed and passed through a segmentation + measurement workflow. In the manuscript this ROI-based approach reduced the deskewed data ~2.6-fold and completed in ~12 h, whereas full field-of-view processing did not finish within 48 h.
Data and code
The raw data, ROIs, ilastik classifier and processing scripts are published on Zenodo: zenodo.org/records/20837879. The file paths below are placeholders — point them at your own copies. See the HPC / SLURM example for running this at scale on a cluster.
The pipeline
For each ROI (one per cell), napari-lattice runs:
- Deskew the cropped LLS volume.
- Segment the nuclei with a trained ilastik pixel
classifier, threshold the probability map, and post-process (connected components, size
filtering, hole filling) with
pyclesperanto_prototype. - Measure morphology and intensity per timepoint with scikit-image
regionprops.
The segmentation + measurement step is packaged as a
napari-workflows file. Its first
task takes deskewed_image as input, so napari-lattice feeds each deskewed ROI straight
into it:
# netosis_seg_measure.yml
!!python/object:napari_workflows._workflow.Workflow
_tasks:
  net_seg_workflow: !!python/tuple
  - !!python/name:netosis_segmentation_workflow.netosis_segment_measure ''
  - deskewed_image        # <-- napari-lattice injects each deskewed ROI here
  - pixel_classifier.ilp  # trained ilastik classifier (same folder as the .yml)
  - 0.6                   # probability threshold
Inputs
| Input | What it is |
|---|---|
6h_timelapse.czi |
Raw LLS7 timelapse (nuclei channel) |
cell_rois.zip |
Fiji ROI Manager file — one ROI per cell, drawn on the acquisition MIP (see Defining ROIs) |
netosis_seg_measure.yml (+ netosis_segmentation_workflow.py, pixel_classifier.ilp) |
The segmentation + measurement workflow and its assets, all in one folder |
Option A — in the napari plugin
Good for setting up and checking the analysis on a few ROIs before scaling out.
-
Deskew — drag the
.cziinto napari and select it underImage Layer(s) to Deskewon theDeskewtab. Because this is Zeiss LLS7 data, leave the defaults:Pixel Size Sourcestays on Image Metadata (the pixel sizes are read from the czi), with skewY, a 30° angle andCoverslip Rotationon. A green tick on the tab confirms the parameters are valid. RunPreviewonce to get a deskewed volume to draw/check ROIs against.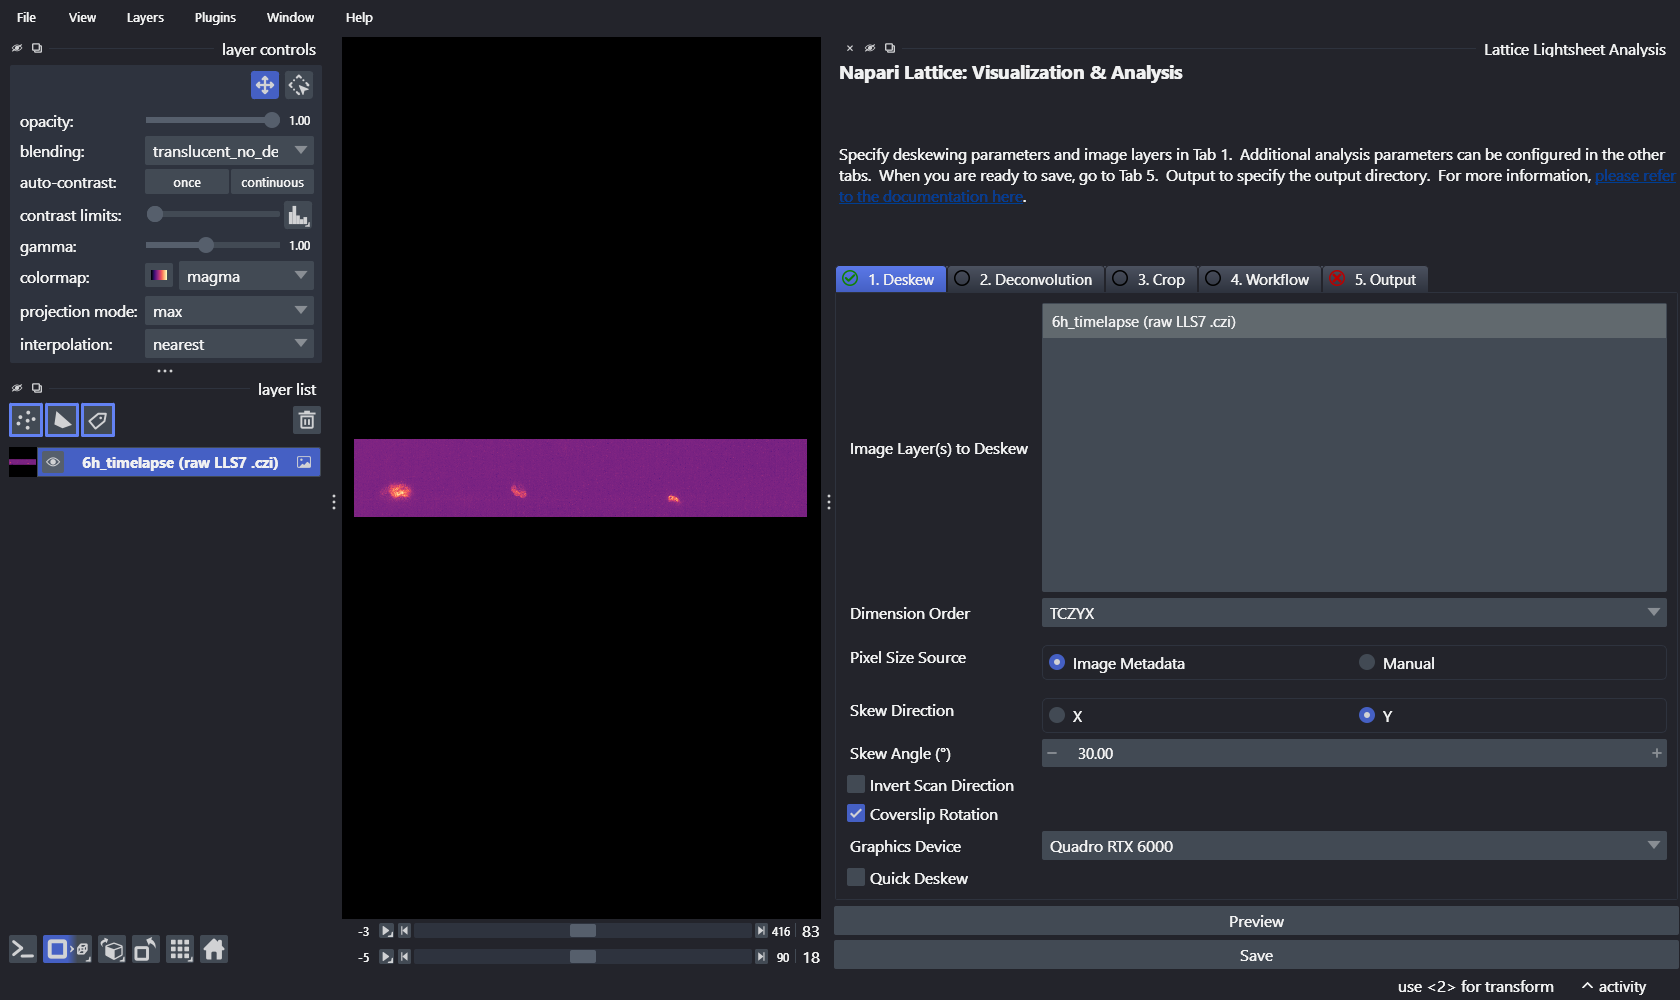
-
Crop — in the
Croptab, tickEnabled, clickImport ROIand selectcell_rois.zip. The ROIs appear as a yellowShapeslayer, each rectangle enclosing one cell, overlaid on the deskewed image. (See Using the plugin → Cropping.)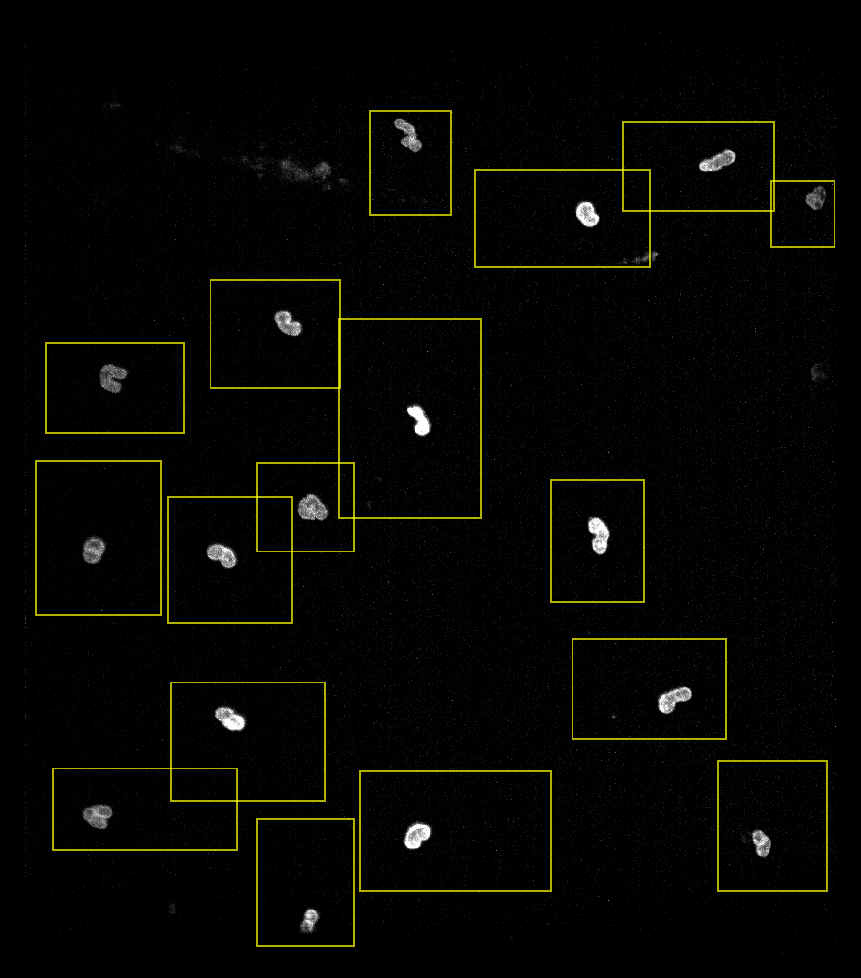
Deskewed nuclei from one timepoint of the timelapse (maximum-intensity projection), with the 17 imported cell ROIs overlaid — each yellow rectangle bounds a single cell for cropping.
-
Workflow — in the
Workflowtab, tickEnabled, setWorkflow SourcetoCustom Path, and selectnetosis_seg_measure.yml. A green tick confirms it loaded. -
Output — in the
Outputtab choose aSave Directoryand setSave Formattoh5, then clickSave.
Option B — on the command line
For batch/headless runs, put the parameters in a small YAML config and call
lls-pipeline. This is the same config style used in the published scripts:
# neutrophil_config.yml
input_image: "/data/neutrophils/6h_timelapse.czi"
save_dir: "/scratch/neutrophils/results/"
save_type: "h5"
channel_range: [0, 1]
workflow: "/data/neutrophils/workflow/netosis_seg_measure.yml"
crop:
  roi_list: "/data/neutrophils/cell_rois.zip"
Run every ROI through the pipeline:
Processing ROIs in parallel
ROI processing is controlled by --process-parallel. If you don't set it, the CLI defaults
to 0 (auto), which derives a memory-safe worker count from a memory estimate:
# Auto (process_parallel = 0): a memory-safe worker count is chosen for you
lls-pipeline process --yaml-config neutrophil_config.yml --process-parallel 0
To take control, pass an explicit number of workers — for example 4 (if you have a small GPU) or 17 (large GPU and process all ROIs) — to spread the selected ROIs across 17 worker processes that share one GPU:
# Explicit: distribute the ROIs across 17 workers on the shared GPU
lls-pipeline process --yaml-config neutrophil_config.yml --process-parallel 17
This pipeline needs an explicit worker count
Auto (0) is disabled for workflow and deconvolution runs (whose memory cannot be
sized) and falls back to serial. Because this pipeline uses a workflow, --process-parallel 0
will run serially — pass an explicit number (e.g. 4, 8 or 17) to actually parallelise. Use
lls-pipeline estimate to help pick a value.
You can also restrict which ROIs run with --roi-subset (e.g. --roi-subset 0,2,5), which
is handy for testing a single cell or splitting work across jobs.
Output
For each ROI and timepoint the pipeline writes the cropped/deskewed image and its
segmentation label image (as h5), plus a table of regionprops measurements (area,
intensity statistics, axis lengths, solidity, etc.) — giving per-cell 3D dynamics over the
whole timelapse.
Next: run this as a single SLURM job on an HPC cluster.